Three ways to analyze your journal entries using data analysis
For the past year or so, I’ve been keeping a personal journal.
In this podcast episode, Derek Sivers explores the benefits that journalling has had for his life. Sivers views his journal as a powerful source of data, and he argues that analyzing this data can reveal empowering insights about your own mind.
I agree on both counts. My journal is a really important tool for emotional regulation, and it helps me every day. And it helps me feel like the emo kid I am at heart. But it’s also useful to analyze to reveal trends. The fact that I write my journal in plain text files (rather than in a physical book or, God forbid, a Word document) means that it’s really easy to analyze using standard data analysis software.
Here are three ways that I analyze my journal. These are just three methods that I’ve found useful so far. Unlike my dear sister Michelle, I am not a qualitative researcher, so there are probably many powerful methods for analyzing text that I don’t know about. There are also many new machine learning methods for analyzing text. I have chosen not to hand my journal over to large language models like ChatGPT, but others might find it useful to do so (in which case, see this code).
I haven’t provided code for these examples, because my journal is structured in an idiosyncratic way, and the code depends on how the journal is structured. But they’re all pretty trivial. I use R for the first and third example, and bash for the second example.
Simple keyword searches
In R (or any other language), it’s easy to do keyword searches. If you output the results as a Markdown-formatted text file, then you can also use Pandoc (which I call from within R using the system() command) to automate the process of building pretty PDFs. I’ve written R code that automates both processes. This way, I can automatically produce a report that simply lists the full text of all my journal entries that contain a specific keyword.
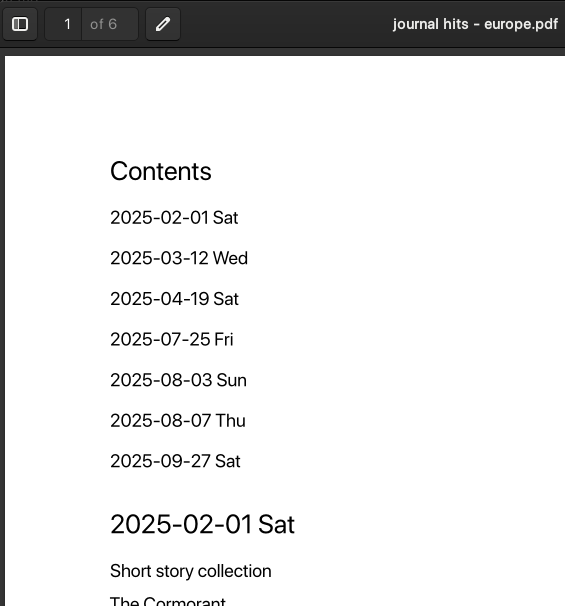
For example, if I use my code to perform a keyword search for “europe”, I get a 6-page PDF file that contains these 7 journal entries:
Word cloud
There’s an excellent command-line tool called wordcloud_cli, which can very easily generate word clouds for a given text file. If you create a word cloud of your journal, you can see what words are most common, which can give you some initial insight about what topics have been on your mind.
wordcloud_cli --text test_journal.txt --imagefile output.png --background "white" --color "blue" --width 800 --height 550 --min_font_size 6 --max_font_size 120 --margin 4
Here is the word cloud for my journal (with some spicy words removed, as I’m posting this on the internet!).

Sentiment/valence analysis
There are lots of tools where you input a passage of text and output a score that is supposed to capture the sentiment or mood of the author. There’s a great example of this idea applied to Twitter posts here. That’s just one example - there are many similar papers floating around the literature, and they involve a variety of different software tools or algorithms.
One such tool is VADER (Valence Aware Dictionary and sEntiment Reasoner), first published here and available from GitHub here. I chose VADER for this example because a) I like the name, b) it’s well-documented, and c) it has been ported to R here.
I used VADER in R to calculate a valence score (from -1/very unhappy, to +1/very happy) for each line in my journal. Then, I took a simple average across each day, giving me an estimated valence score for each day.

Alternatively, you can visualize this data as a series of colored bars, where the color represents the negative or positive intensity. This is the same technique as the iconic climate stripes. Sadly, this doesn’t look as good for my journal entries - there are lots of gaps, more data points, and there’s lots of variance from day to day. So it looks a bit ugly. You could address some of this by averaging over months rather than days, but my mood varies significantly from day to day, so I don’t think monthly averages would convey any useful information.
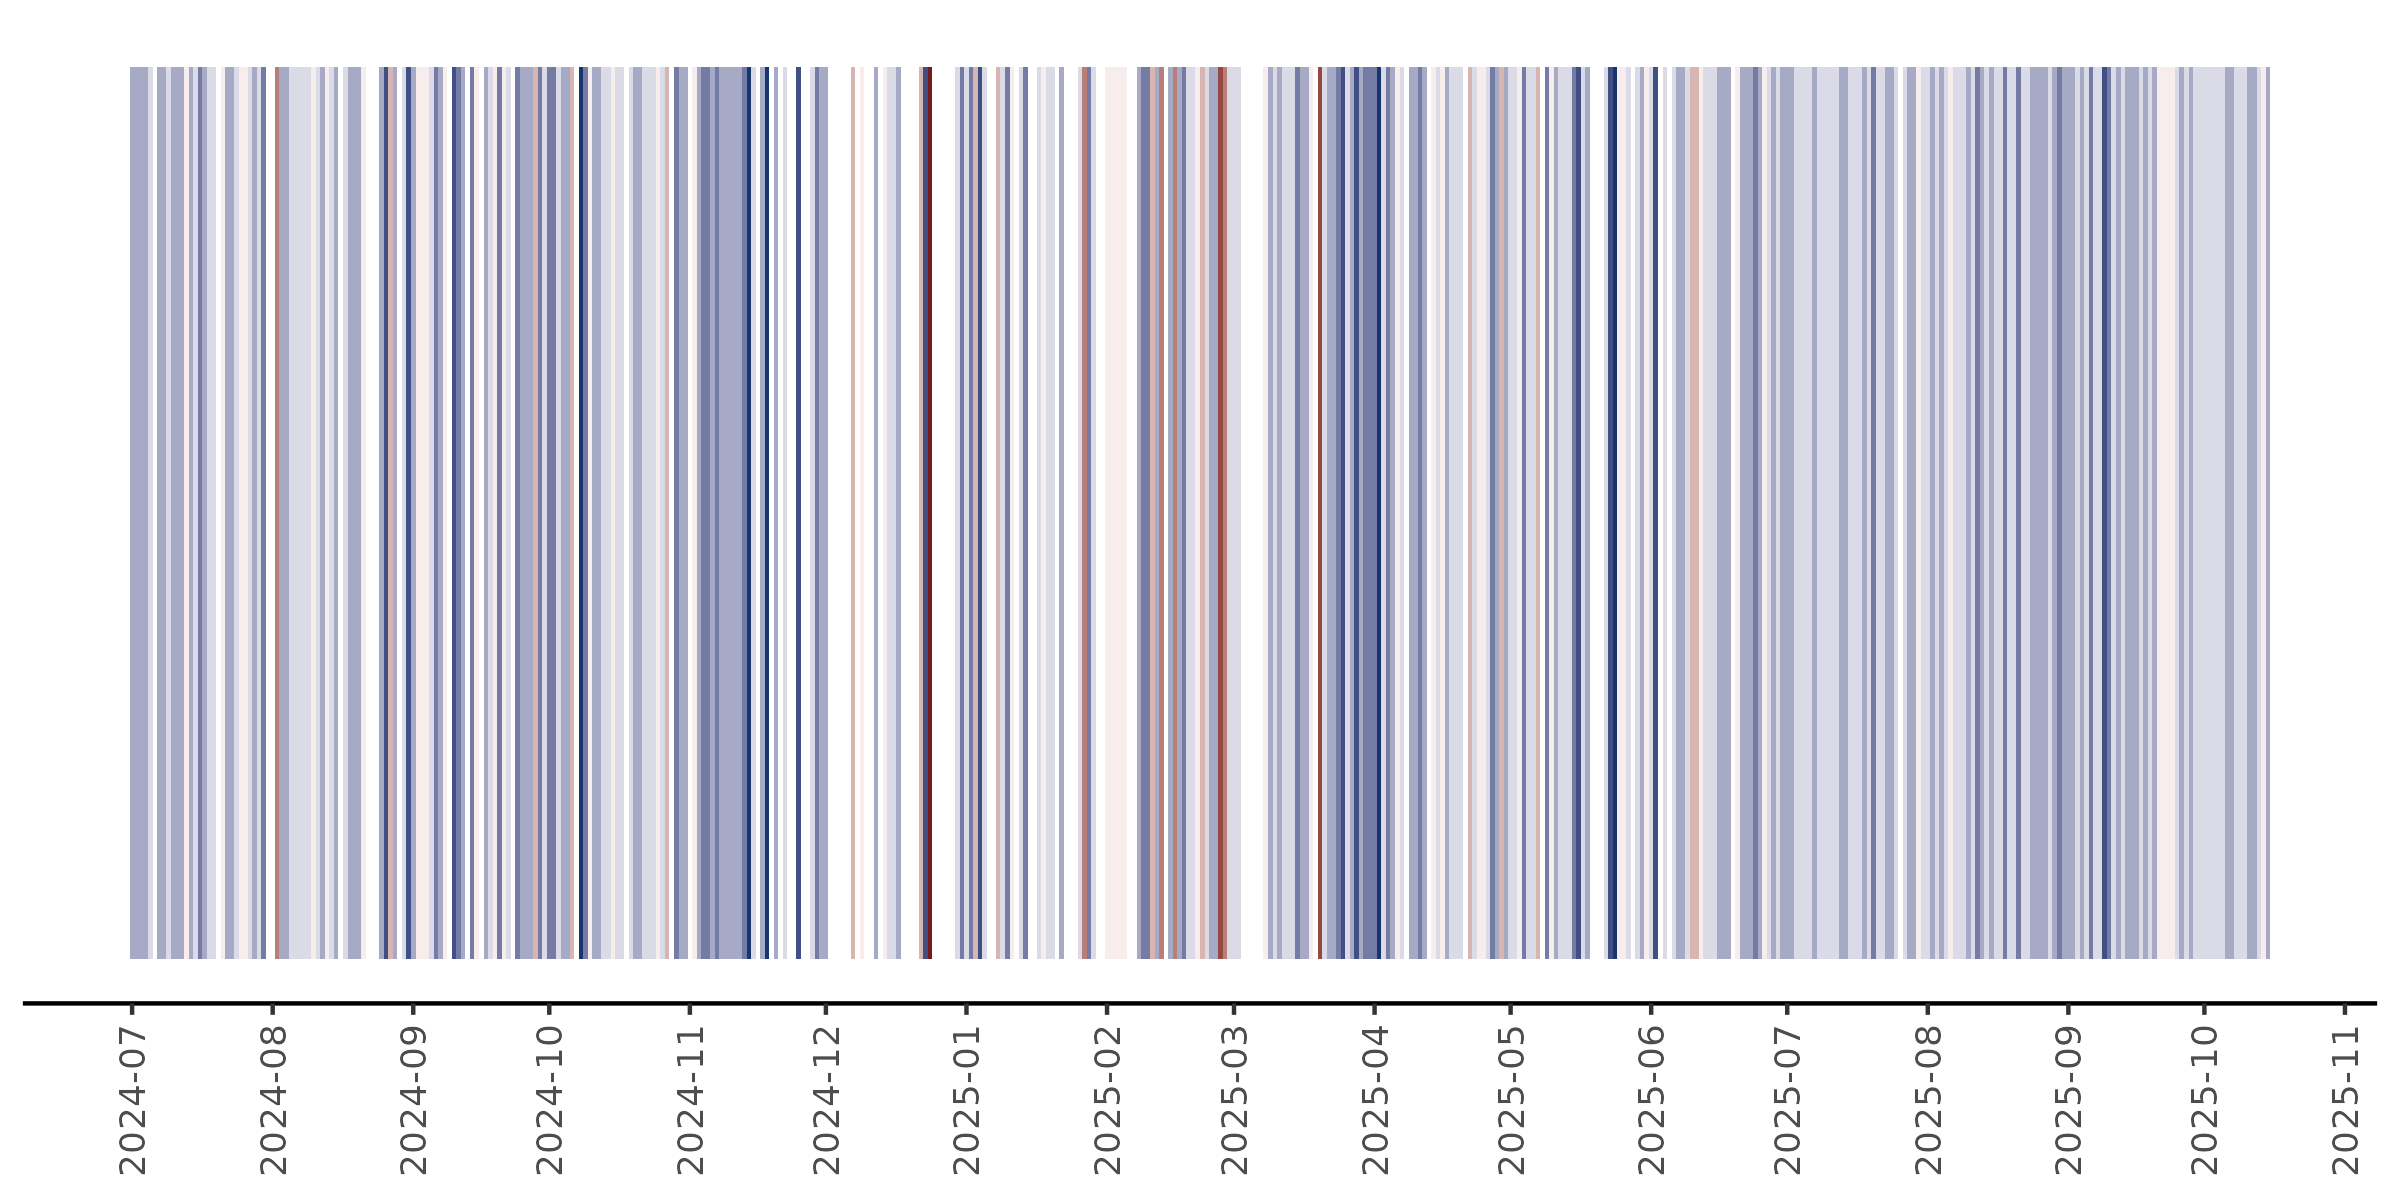
Either way, VADER hasn’t revealed the trends I was expecting. For example, there was a huge crash in my mood in mid-September 2025, but this does not show up on this graph. Perhaps a different method for sentiment or valence analysis would be more appropriate and would capture mood changes like that one.